

We minimise impact at every level

How we currently estimate our water impact
We use 'side stream' i.e., biomass that is currently grown but not used. Further, our production processes use minimal water. It could be argued that our use of ' Blue Water' (surface/groundwater abstraction, excluding rainfall) should have a minimal burden allocation as the alternative use has limited value and our activities do not fundamentally change production output, however below we offer an allocation approach, albeit a simplistic one based on mass. We note that economic allocation, system expansion/substitution, or cut-off approaches are common in by-product LCAs, and also that it is likely that an 'economic allocation' based on value of outputs would be lower than the mass-based approach below as side stream is less valuable than the currently grown product, thus the final value is likely to be below that estimated below.
Water use currently associated with broccoli horticulture
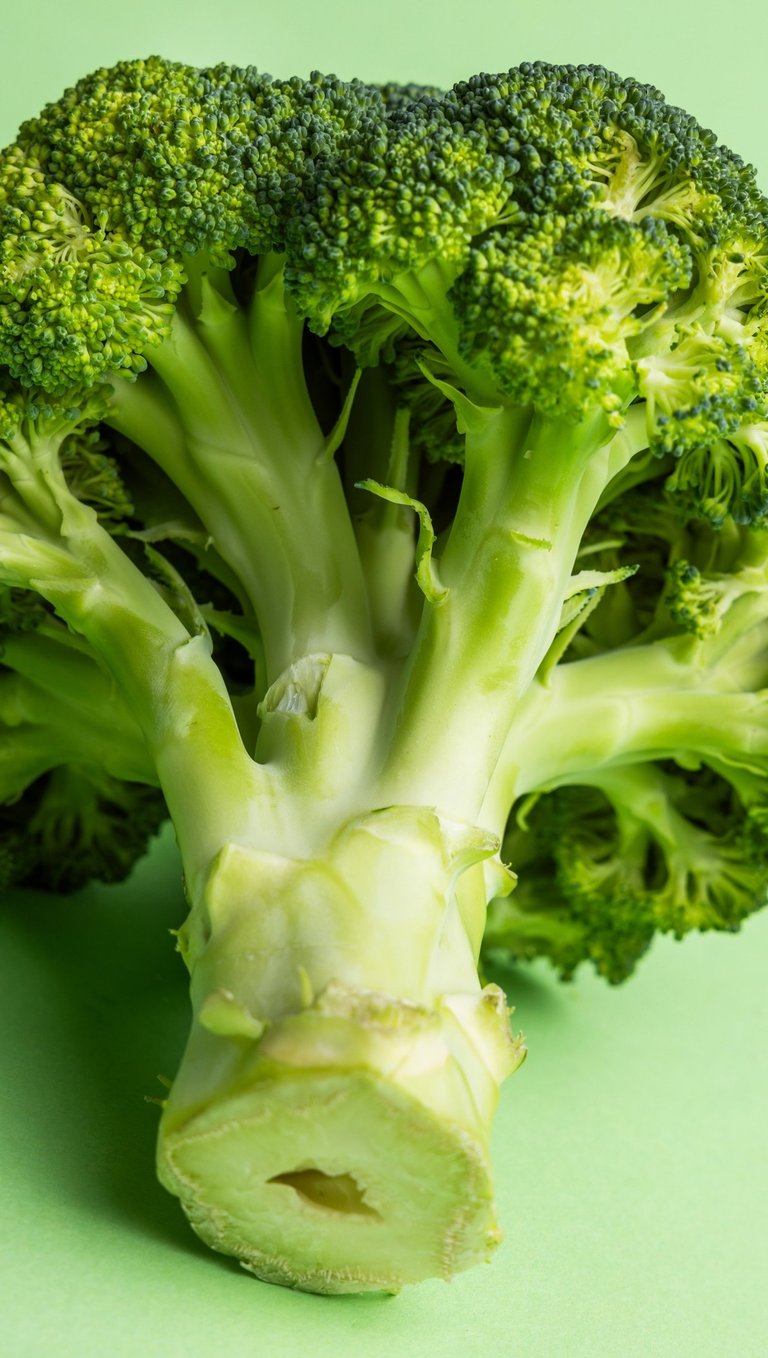
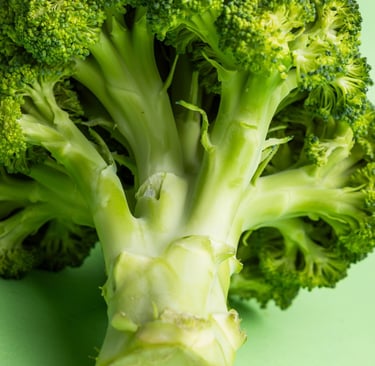
Where possible we source broccoli grown in the UK, which is generally available from July through November. UK broccoli has been assessed as having a 'Blue Water' use of nil. When UK broccoli is not available, we use broccoli grown in Spain (ordinarily the Murcia region), This has an assessed Blue Water use of 121 m3/t. If we factor in the longer Spanish growing season, then ~54% of our broccoli side stream will be Spanish, giving a blended Blue Water use of ~ 65 m3/t. This value is for the currently sold head and so represents the water for the entire plant.
If you take the view that water use should be allocated between the head weight and the side stream products on the basis of mass, then as there are 2kg of our products for every kg of head weight, thus the Blue Water use would be ~22 m3/t, and it would reduce the attributed Blue Water for the head.
Comparative values
Quorn states the following values as comparables, all stated as Blue Water use in m³/tonne:
Beef: 1048
Chicken: 73
Pork: 320
Mycelium (mycoprotein): 31
Soy protein (concentrate): 83
Pea protein (concentrate): 76
It is highlighted that a reader should consider the diversity of the ingredients used in the comparison. Further, our numbers are based on broccoli cultivation allocation logic, while the comparator figures (beef, chicken, soy concentrates, etc.) can be derived under different boundaries/methods (and sometimes represent very different supply-chain stages). Even if each number is “true” in its own context, cross-comparison can be misleading without harmonised system boundaries and functional units.
We turn under-used broccoli plant material into nutritious ingredients. Because this material is already grown as part of normal food production, our starting point is different from crops grown specifically to produce ingredients. This page explains how we currently think about water and land use in simple terms, and where the numbers are still evolving. The summary below primarily relates to broccoli cultivation burdens and allocating them - not a full cradle-to-gate water/land footprint of their ingredient including processing energy, cleaning/CIP, wastewater, packaging, and transport assumptions.
Important: The information below is not a full Life Cycle Assessment (LCA). It is an early-stage estimate designed to show our reasoning and the assumptions we use today. We use "Blue Water" below as this is what customers have requested us to estimate, however we understand that Blue Water with a water scarcity impact metric (e.g., AWARE-style weighting) may be more appropriate. An interim LCA can be seen on this page, and we expect to conduct a full LCA with goal/scope and justification (cut-off vs system expansion vs economic allocation, etc.) at a later date. We are refining our figures as we scale and collect more primary data; specifically the stable representative operating data needed for a full ISO-compliant cradle-to-gate assessment. Crucially, for an upcycling / side-stream business, the core uncertainty is allocation and we are assessing the most appropriate methodology for this.
How we currently estimate our land impact
The 'side stream' argument i.e., biomass that is currently grown but not used could again be deployed, giving a minimal land use. Again, below we offer a simplistic mass-based allocation approach.
Land use currently associated with broccoli horticulture
Where possible we source broccoli grown in the UK, which is generally available from July through November. UK broccoli has been assessed as having a land use of 0.901 m2/kg and Spanish broccoli 0.644 m2/kg. If we factor in the longer Spanish growing season, then ~54% of our broccoli side stream will be Spanish, giving a blended land use of ~ 0.76 m2/kg. This value is for the currently sold head and so represents the land use for the entire plant.
If you take the view that land use should be allocated between the head weight and the side stream products on the basis of mass, then as there are 2kg of our products for every kg of head weight, thus the land use would be ~0.25 m2/kg, and it would reduce the attributed land use for the head.
Comparative values
Quorn states the following values as comparables, all stated as land use in m2/kg
Beef: 68.3
Chicken: 12.0
Pork: 17.3
Mycelium (mycoprotein): 1.7
Soy protein (concentrate): 5.2
Pea protein (concentrate): 1.4
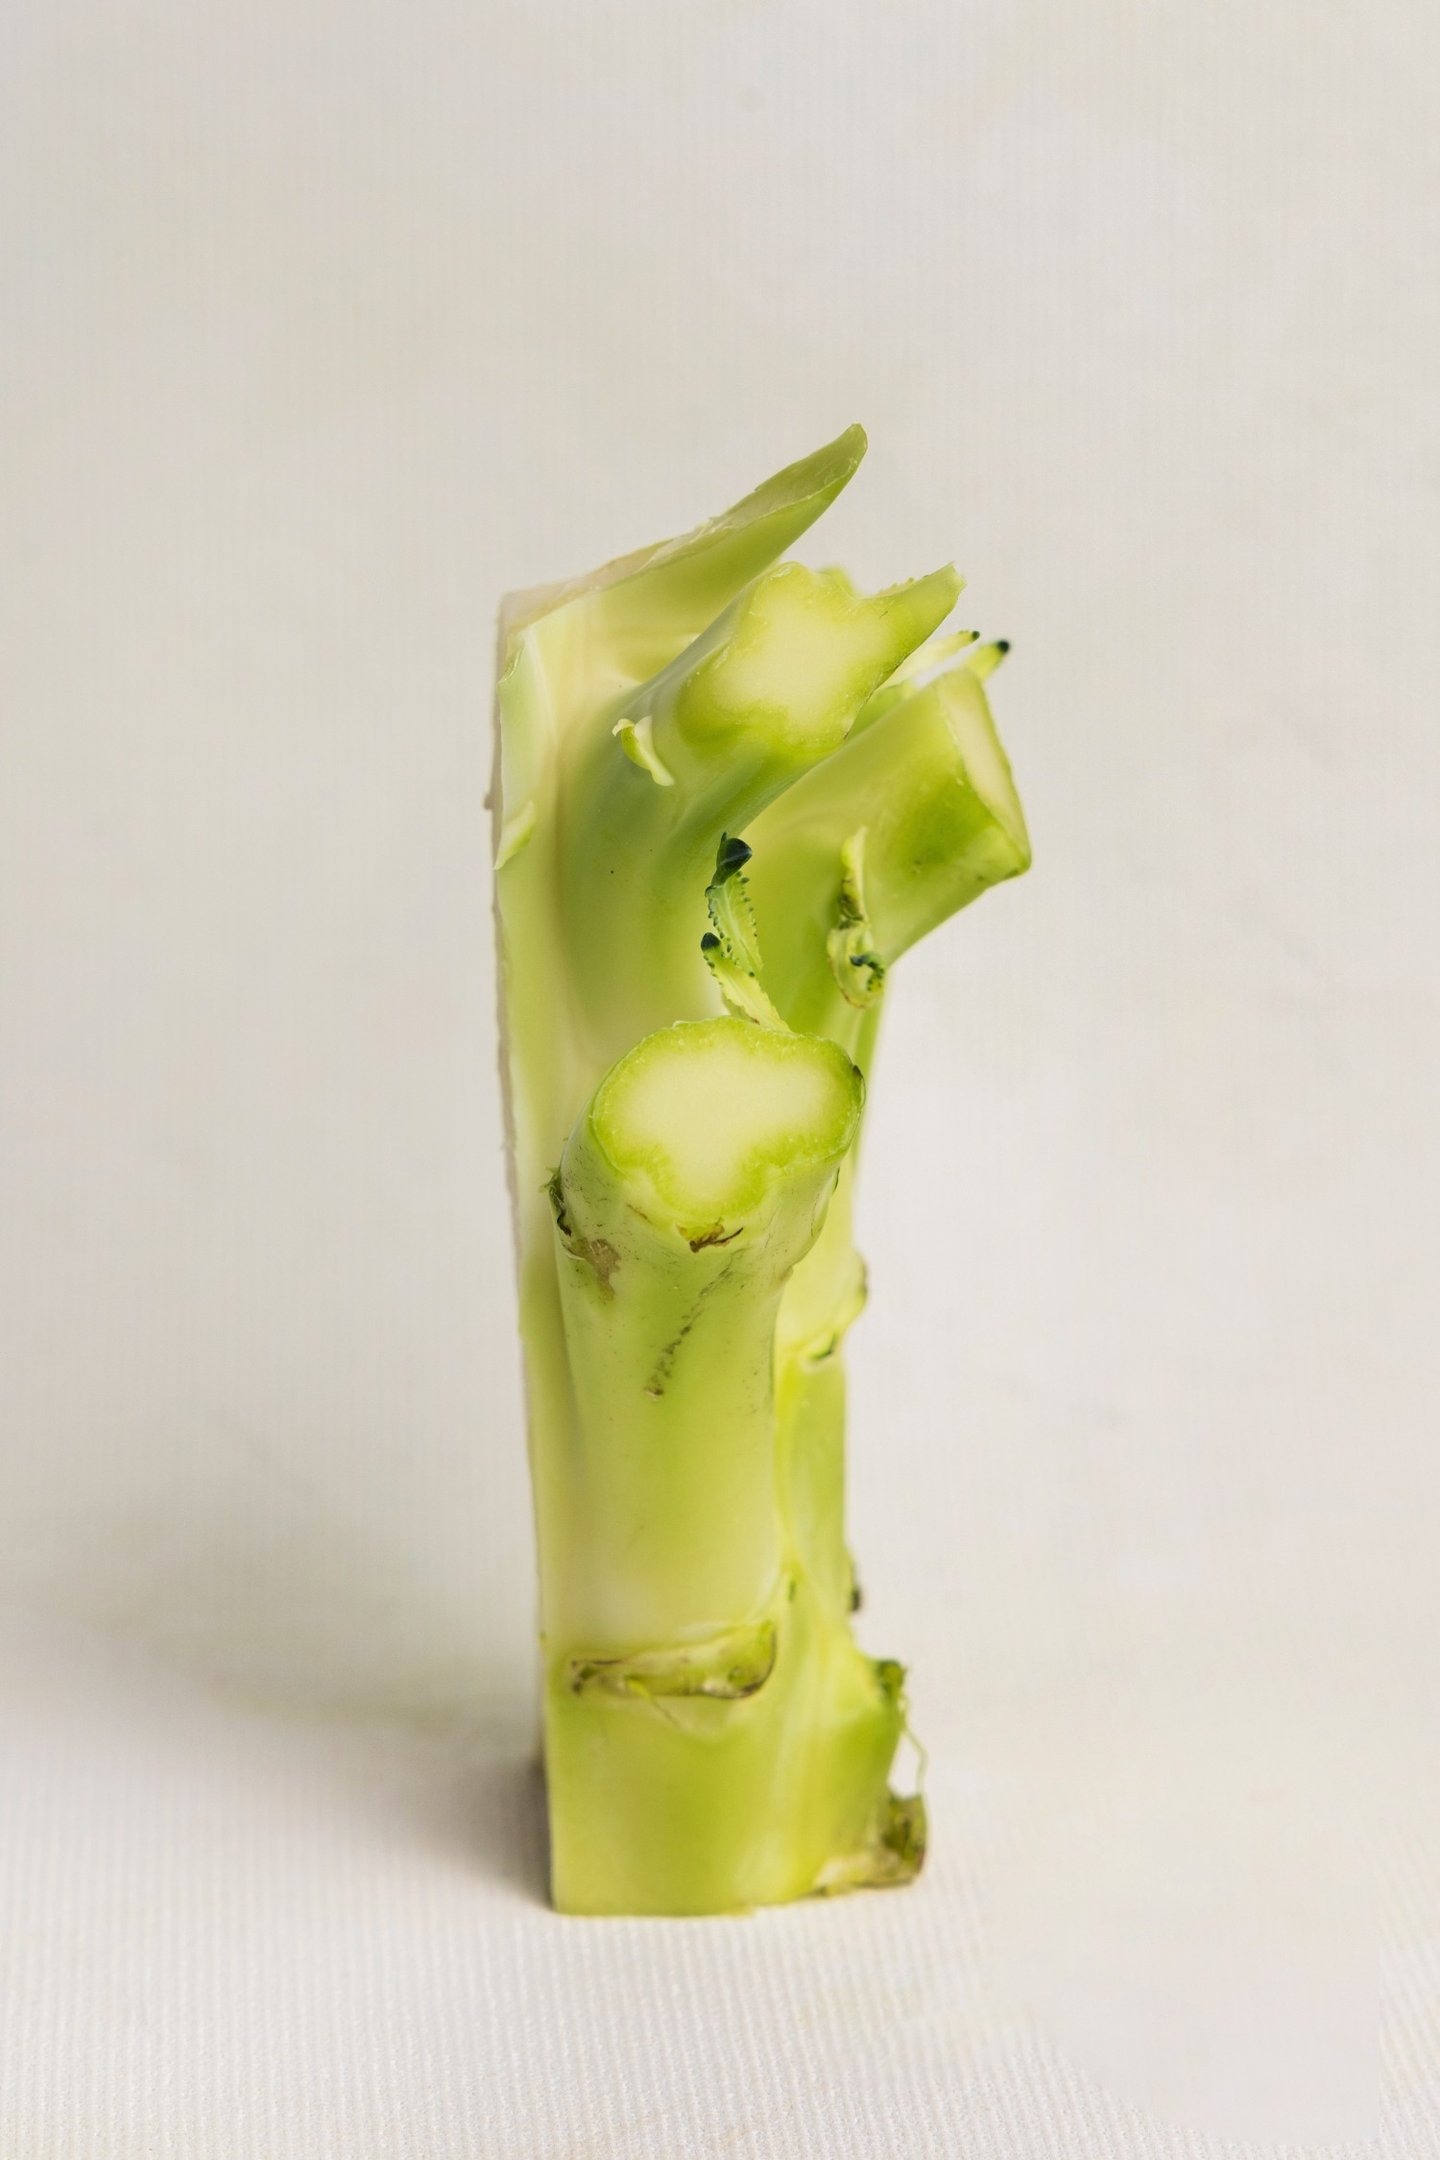
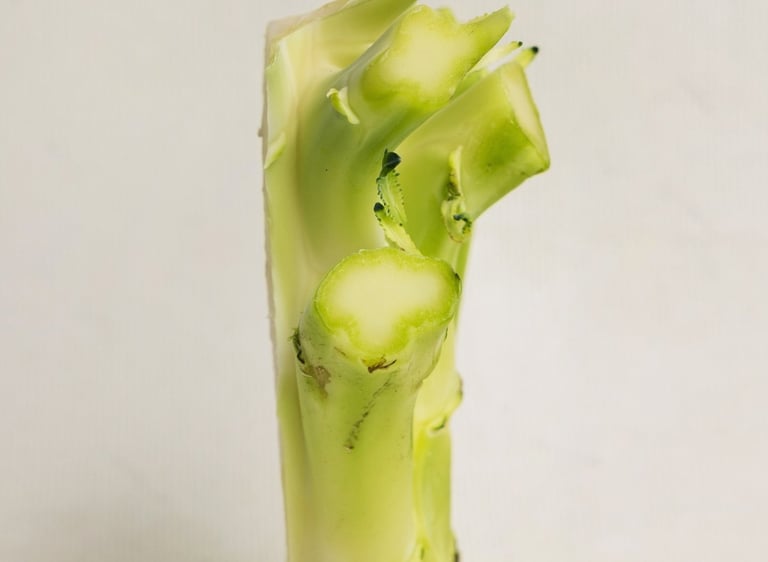
Summary: Broccoli fields produce both edible heads and additional plant biomass (stems and stalks). Traditionally, much of this extra biomass is left in the field or used for low-value purposes. Our process uses a portion of this existing plant material Because this biomass is not grown specifically for us, a key question is how much of the farm’s water and land use should be attributed to our ingredient. There are several accepted methods in environmental accounting (for example, “cut-off,” “mass,” or “economic” allocation), and each produces different results At this stage, we present one simple method to make our assumptions visible rather than to claim a definitive footprint.
Using existing plant material has the potential to reduce additional demand on land and irrigation compared with ingredients grown from scratch. Our current numbers are directional indicators, not final answers. We share them to be transparent about our thinking today and to set a clear path toward more rigorous, independently reviewed impact reporting as we grow.
Get in touch
© 2026. All rights reserved.
Upcycled Plant Power ('UPP') Limited
trading as "UPP" and "Freya"
Company number: 14171122
VAT Number: 428 2222 17
Registered address:
Agri-Tech Centre
Poultry Drive, Edgmond,
Newport, Shropshire
United Kingdom TF10 8JZ
Connect with us
Broccoli is a natural source of vitamin K and contains folate, potassium and beta-carotene, a provitamin A carotenoid. Our Fiba and Prota products are a source of fibre, making them nutritionally valuable ingredients.
